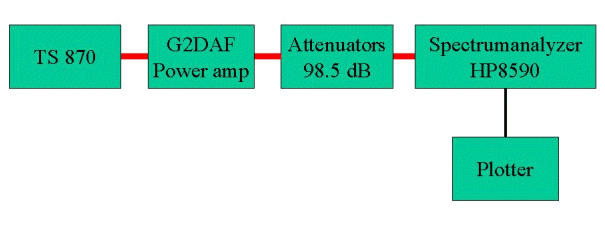
Measurements made on the EBK-1 (SM3BDZ) was done with a simple setup shown in the picture below.

Measurements made on the EBK-1 (SM3BDZ) was done with a simple setup shown in the picture below.

Two different measurements were made:1. Linearity check
A simple with / without amplifier check was done.2. Harmonic suppression
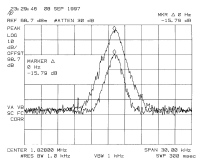
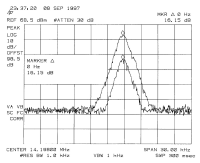
SM3BDZ was calling his callsign into the microphone of the TS 870 and SM3PXO used the max hold function to get the peak of the power saved on the spectrum analyzer screen. The same thing was then done with the power amplifier turned on.The plots shows that the G2DAF amplifier does NOT add anything to the signal coming from the TS870 transceiver other than amplifying it about 16 dB.
The harmonic contents of the power output was checked by looking at the spectrum when transmitting on 3.777 MHz. The signal out at the second harmonic was more than 58 dB down from power output at the fundamental transmitting frequency. The plot only shows the second harmonic, the other harmonics were also checked with the same result.Click on the pictures for better resolution.

